

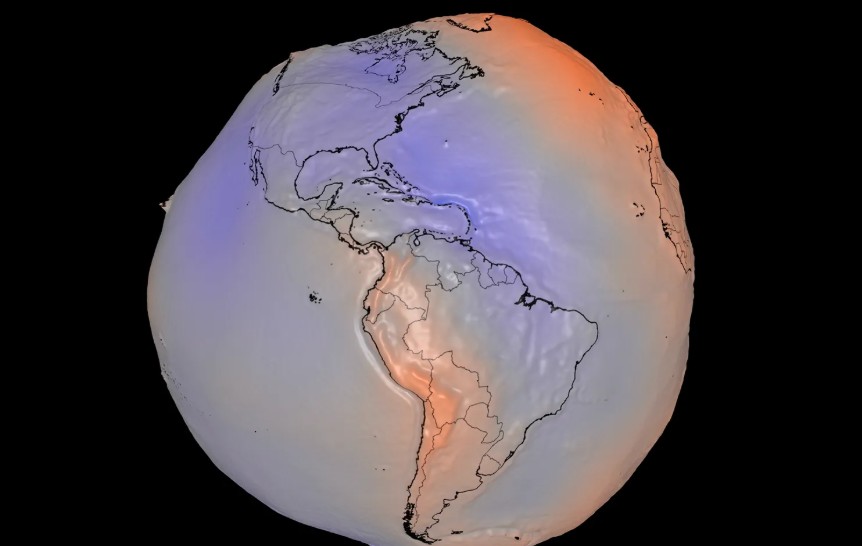
NASA has released a new three-dimensional visualization that presents Earth very differently from the familiar smooth, spherical planet seen in photographs from space. The model depicts the geoid, a representation of Earth’s gravitational field shaped by variations in the distribution of mass within the planet, tells Wired.com (full article available to subscribers).
The geoid can be understood as the theoretical surface Earth’s oceans would form if they were influenced only by gravity and the planet’s rotation. Differences in Earth’s gravitational field produce subtle elevations and depressions across this surface. To make these variations visible, NASA exaggerated their heights by a factor of 10,000, giving the visualization its dramatically uneven appearance.
Creating the model required an enormous amount of satellite data. It draws on 15 years of observations and incorporates about 1 billion measurements. Satellites can detect extremely small differences in gravity from one location to another, allowing scientists to build detailed models of the planet’s gravitational field. NASA has also made an interactive version of the 3D geoid available for exploration.
These gravity measurements provide much more than an unusual picture of Earth. Data from NASA’s Gravity Recovery and Climate Experiment, or GRACE, helps researchers monitor changes in the planet’s mass caused by moving water and ice.
Satellite measurements indicate that Antarctica lost about 135 gigatons of ice annually between 2002 and 2025. Greenland lost approximately 264 gigatons per year during the same period. More precise estimates of these losses can improve scientists’ understanding of present and future sea-level rise.
GRACE observations also reveal groundwater depletion and drought. They have documented long-term groundwater losses in the western United States and can identify shorter-term changes in soil moisture and shallow groundwater.
As climate change intensifies drought in many regions, gravitational measurements could provide increasingly valuable information for monitoring water availability and helping water managers understand changes that are difficult to observe from Earth’s surface.
